


 27Likes
Timing on Brushless motor
 07-21-2020 | 08:34 PM
#16
Tech Master
Joined: Jul 2018
Posts: 1,011
From: Florida
Just to clue you in as you are very much into industrial motor control. I was a mechanical engineer and worked very closely with the electrical/control engineers. I often was working the mechanics with them to optimize performance typically in the area of inertia matching. I have been out of that for 12 years now after 36 of them involved with it. I keep digging for ways to apply what I know and learn new things all of the time. Once a engineer, always one.
if you are trying to find ways to apply what you know we are like minded. at some point I would like to model a chassis in a motor selection software (some still prefer to do it by hand) and use the rules of thumb for inertia on a BLDC motor. based on the way we accelerate and decelerate I would match the motor rotor to the chassis below 30;1. but based on just looking at the way we accelerate and decelerate I think its a little too high. position10>1, reciprocate 30>1, and line shafting at 60>1. I wont hog all the glory if you want to crack that nut.
I dont think that a dead weight on the motor shaft would be illegal.
 07-22-2020 | 09:20 AM
#17

Joined: Feb 2011
Posts: 8,406
well then we are birds of a feather. While in school I worked at Honda on the machine design team. i went to work for Mori Seiki (Fanuc and Mitsubishi guy), then indramat that turned into Mannesman Bosch Rexroth. I started as the the guys who designed the control systems (starting with servos and spindles) for whatever new job we had. Indramat developed the first digital ac servos (not me) and i was responsible for all the inertia mismatch in the great lakes region. At that time most of the competition sized based on horsepower. you very well could have gotten a design from me starting around 94. If you were using our stuff and had a bad sizing from a distributor or elsewhere...oops. I got lucky. Indramat guarenteed designs and I had good teachers. Indramat basically owned the auto industry back then.
if you are trying to find ways to apply what you know we are like minded. at some point I would like to model a chassis in a motor selection software (some still prefer to do it by hand) and use the rules of thumb for inertia on a BLDC motor. based on the way we accelerate and decelerate I would match the motor rotor to the chassis below 30;1. but based on just looking at the way we accelerate and decelerate I think its a little too high. position10>1, reciprocate 30>1, and line shafting at 60>1. I wont hog all the glory if you want to crack that nut.
I dont think that a dead weight on the motor shaft would be illegal.
 07-22-2020 | 09:18 PM
#19
Tech Master
Joined: Jul 2018
Posts: 1,011
From: Florida
Oh there was some rotor inertia drama in the past?
it has a purpose. Im still not sure how much it would do in rc. the reason its a thing at all is that Drives with closed loop control (not an esc) have 3 closed loops running simultaneously and they fight each other for processor time. And the code is sequential not simultaneous so these loops fight each other. Current, velocity and position. ESCs only have 1 loop. so a resistance to change in speed or efficiency in change of speed can be managed by rotor inertia (or mass accelerated if thats simpler). if you know the math for each type of application you can control oscillations or lack of response from the motor. in its simplest form ..some motors cog at low rpm. adding the right amount of weight will end the cogging. at higher rpm the cogging still exists and maybe its enough to create some error in the hall effect sensors. there are small differences in acceleration between motor phases that can create small timing errors.
it would be like balancing a tire. but instead of 1 weight at the right spot its a bigger weight on the entire tire. there is more to it then what i explained but that is the fundamental.
07-27-2020 | 11:15 AM
#20
Tech Regular
Joined: Apr 2007
Posts: 370
this is very good information but I cant calibrate myself to it. do you have the labels backwards? a 17.5 should be putting down at least 100 watts on chassis. Im not nay saying your results. you have created something very helpful but maybe the data points are off a bit.
I wouldnt be shocked to see a 17.5 put down 175 watts on chassis and 225-300 motor only.
I wouldnt be shocked to see a 17.5 put down 175 watts on chassis and 225-300 motor only.
Also, as anyone who has checked can attest, the marks on the endbell are almost never correct. So, hand-in-hand with this test is first a test to find the true Zero on the endbell. When that condition is met, most motors I checked have somewhat similar curves. If I designed the motor I'd have a big cooling heat sink, but the point is moot now, as our track is CAN-AM handout motor. So the dyno is just for fun.
07-27-2020 | 11:30 AM
#21
Tech Regular
Joined: Apr 2007
Posts: 370
My dyno is setup different from old dude. I found with experimentation that this particular ESC (and only this one) will power up by being back-fed through the servo cable even when it is turned OFF. So for my tests the ESC switch is actually always OFF. That is crazy but it works, and the light on the ESC lights and shows full throttle, but the motor does not surge or pump with the servo driver (blue box) set to 100% throttle. With this setup, the disk remains perfectly still until the power hits the ESC, controlled from the software start button. So the disk spins up instantly with full throttle from a standing start.

Last edited by ic-racer; 07-27-2020 at 11:53 AM.
07-27-2020 | 11:51 AM
#22
Tech Regular
Joined: Apr 2007
Posts: 370
A little off topic, but in case anyone out there with a Fantom dyno wants to use it with Brushless, I call this the old dude method, from what he showed me and, unlike the method above, it works with all ESCs that I tried. The car's transmitter is set to an 'instant on' throttle curve and you pull the trigger at the same time you click the 'start' button on the software.

 07-28-2020 | 08:37 PM
#24
Tech Master
Joined: Jul 2018
Posts: 1,011
From: Florida
With a 17.5 motor, my dyno showed diminished efficiency that will cause excessive heat after about 30 degrees. But there are a lot of other variables to contend with at the track. Different dynos might show other results too depending on how they are measuring the current going into the motor ("Electrical Energy Consumed" in the diagram). Mechanical power output is calculated from RPM data of a disk of known mass and dimensions.
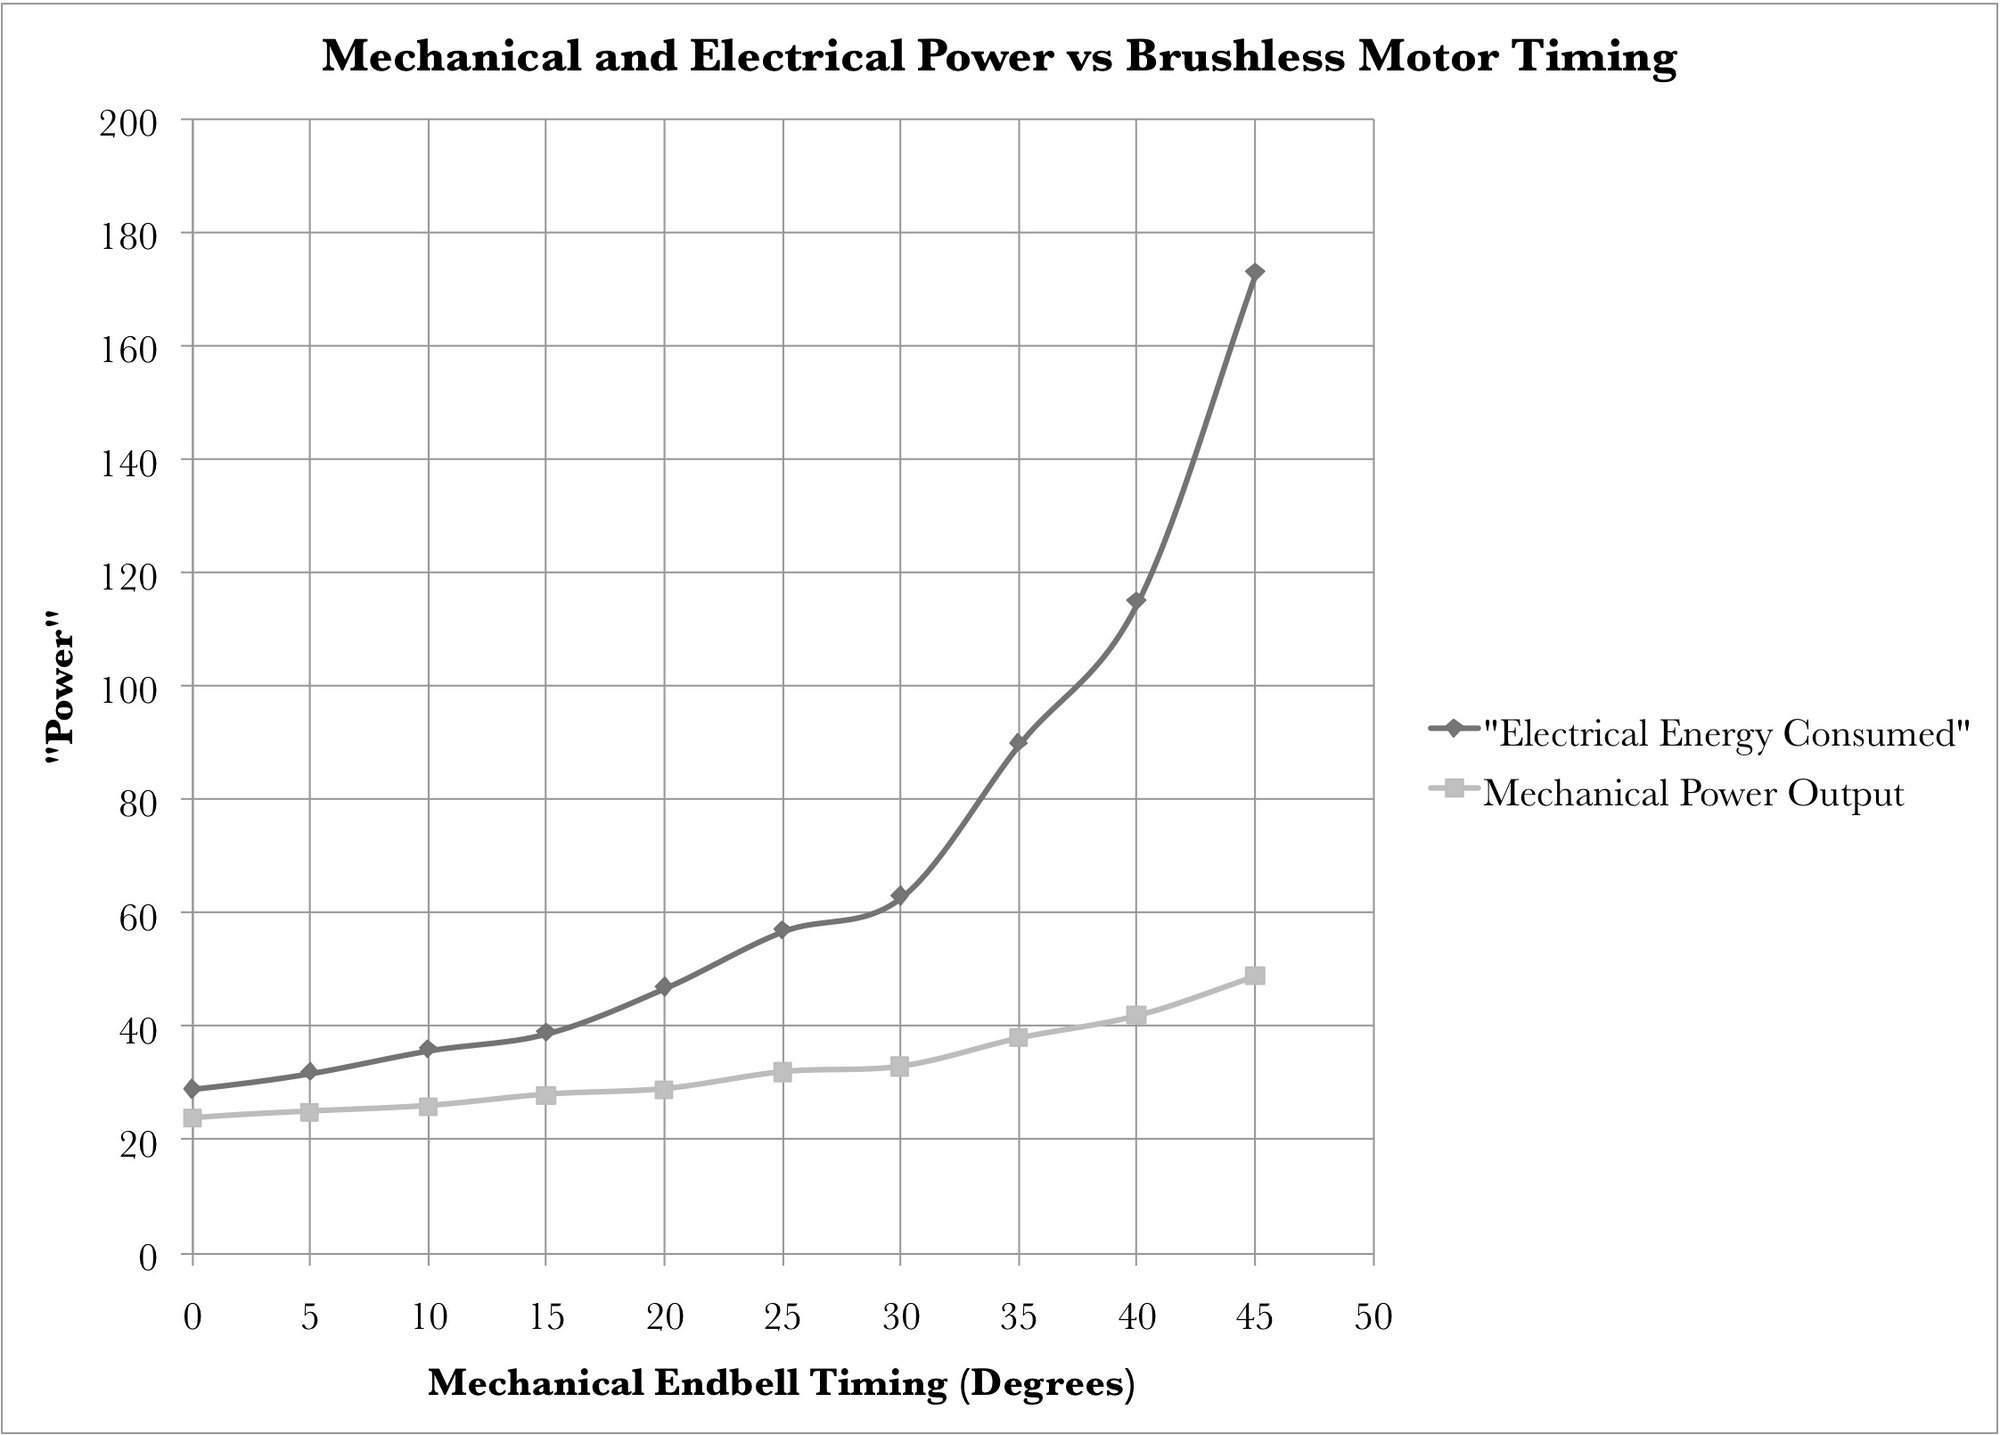
Ok. Ive been pondering this curve for days. there is allot of “stuff” underneath it. there is so much underneath it the curve feels more like something that says “trust me”. I want to but I also need to be able to apply it.For example the vertical axis is power which makes it difficult to abstract allot. the peak of power moves with timing and diminishes. which means anything that has field weakening is going to look bad. the results will always be severely skewed but because peak power drops but also it widens. if the vertical was torque rather than power it would be easier to conceptualize and more information could be abstracted. I could apply it to things of done in the past as a truth test (in my head). I assume voltage is fixed anyways and torque is the result of current. Any chance I can get you to create this curve with torque or current on the left? If you remove “power” from the equation the power constant wont interfere with deep thought, which also means there wont be a tendency for all things to appear as a crossover point at 5252 rpm.
it appears that your curve is like a summary of the difference between electrical power in and mechanical power out. it basically says that field weakening does nothing except generate a bunch of heat. but we know that field weakening improves high rpm response by removing low rpm response. I cant see that in the curve because there is only a tangential reference to speed as an element of power. In other words I cant see the drop in efficiency at low rpm and high rpm with the power picking up around the timing mark. Peak torque should be very close to 1 rpm but power is a measurement that crosses over itself which makes this even harder to understand. you add another degree of freedom to the data with timing. which takes it beyond my brains capability.
Dont get me wrong. I understand the concept you are trying to communicate. its a simple and unique approach to an interesting issue. It even looks horribly simple which is always a bonus in my book. its just at a level that I cant apply it to future problems, I cant check it with my own experience, and there isnt underlying data to help. I live to solve puzzles and Im excited to have an opportunity at this one. Im just hoping for more info.
if the vertical was the slope of torque and rpm, or just torque, or just rpm I could look deeper in to applying the info.
Last edited by Bry195; 07-29-2020 at 08:31 PM.
07-29-2020 | 08:51 PM
#25
Further to this post, I have additional slides to help explain why I asked anyone if they can tell me what they see...
The graphs above contain some interesting details on the performance of the motor that I own.
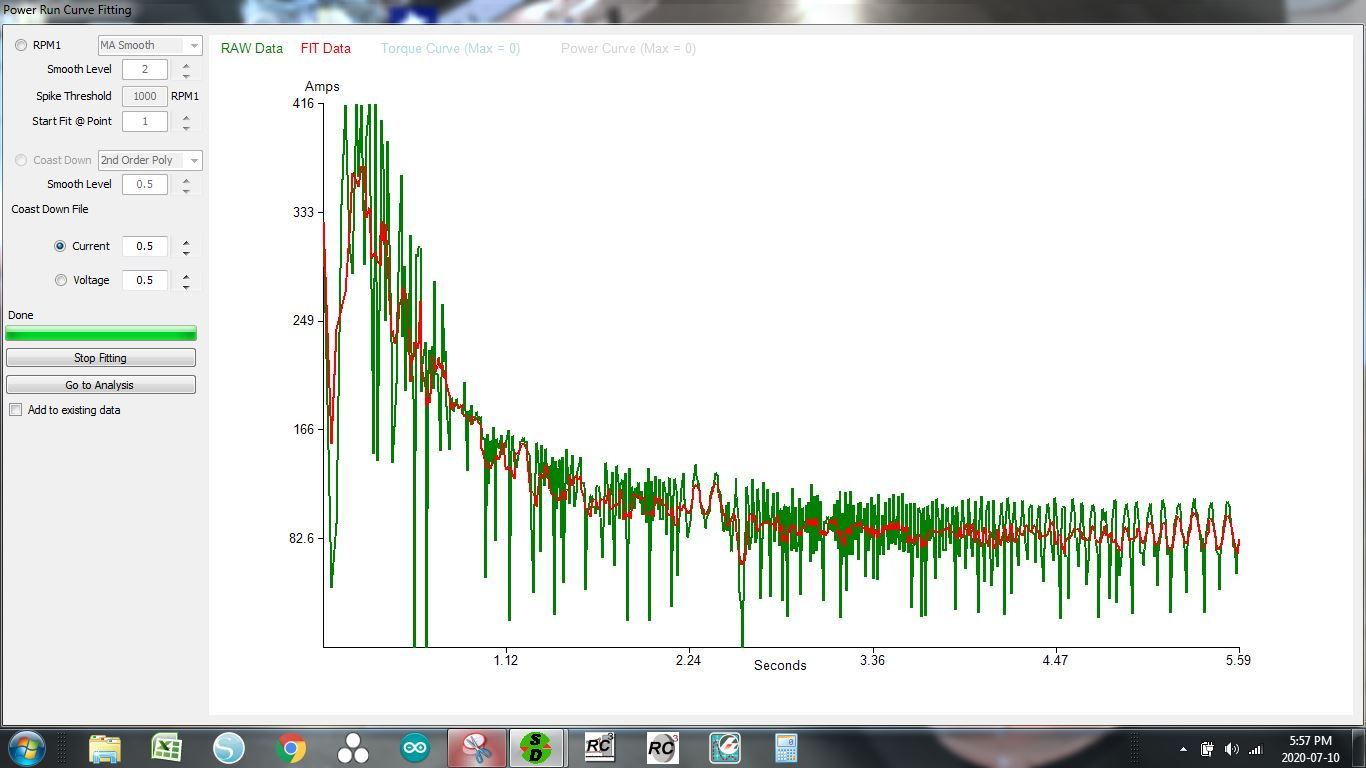
In the two graphs, you can see the length of time the motor need to spool up to reach maximum RPM. The timing on the motor for this test was set at 41 degrees, measured with a motor analyzer. There are two pieces of info that stand out in the graphs.. The first is what you see on the current (amp draw) graph, just after 2.24 seconds, you see a dip in the current and if you use your mouse cursor if using a computer, line it up with that spot and then scroll without moving it. The same spot on the RPM graph could be interpreted as the start of the power band, up until the motor starts to cog, which you can clearly see at the end of the current graph.
Now the next graph is the voltage, which for this test the lipo I have was at storage voltage 7.6v re-peaked with icharger.

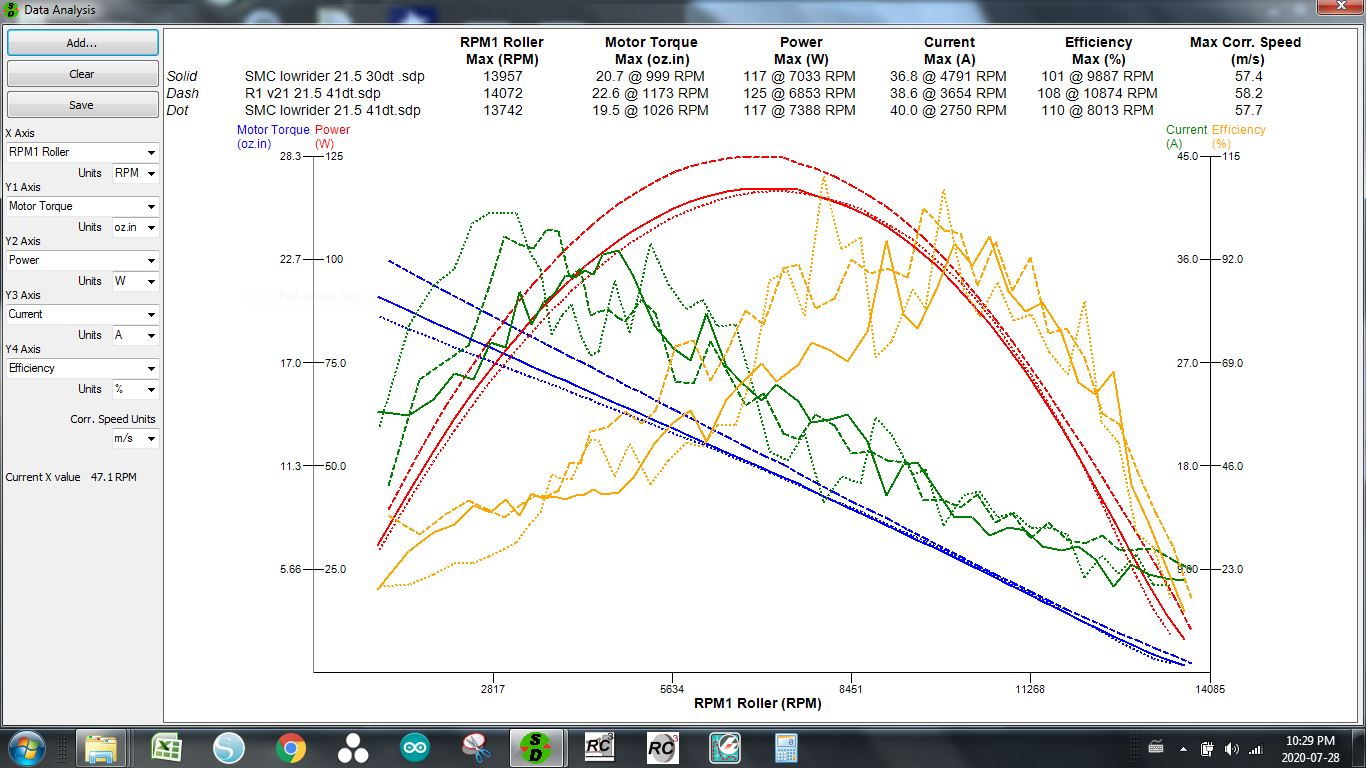
Then torque, power, efficiency and current all over RPM.
In this graph you can see lots of good details, and with a 1:1 ratio, the RPM can be match to with data loggers to ensure you select the best gearing for your layout..
Now does the setting of 41 degrees create the best torque and overall power? Not sure as I need to do more testing to validate this. However as Bry195 mentioned before, "as you increase timing, you are field weakening", which is also known as widening the power. However when it comes to spec racing, you need to find the setting that produces the torque and power that the motor can produce before it starts to generate too much heat. Remember that as you widen the power band, and depending on the track layout you have in front of you should also influence what setting you select. If grip is high, its a no brainer, torque.

Lastly here is a comparison of two motors, with one motor at two different timing settings. You can see the field weakening that happens when you go from 30 to 41 degrees timing for the motor.
For those who are interested in seeing the field weakening results of the R1 v21, I will be posting the results soon on my Facebook page.
08-01-2020 | 09:16 PM
#26
Tech Master
Joined: Jul 2018
Posts: 1,011
From: Florida
Further to this post, I have additional slides to help explain why I asked anyone if they can tell me what they see...
The graphs above contain some interesting details on the performance of the motor that I own.
In the two graphs, you can see the length of time the motor need to spool up to reach maximum RPM. The timing on the motor for this test was set at 41 degrees, measured with a motor analyzer. There are two pieces of info that stand out in the graphs.. The first is what you see on the current (amp draw) graph, just after 2.24 seconds, you see a dip in the current and if you use your mouse cursor if using a computer, line it up with that spot and then scroll without moving it. The same spot on the RPM graph could be interpreted as the start of the power band, up until the motor starts to cog, which you can clearly see at the end of the current graph.
Now the next graph is the voltage, which for this test the lipo I have was at storage voltage 7.6v re-peaked with icharger.
Then torque, power, efficiency and current all over RPM.
In this graph you can see lots of good details, and with a 1:1 ratio, the RPM can be match to with data loggers to ensure you select the best gearing for your layout..
Now does the setting of 41 degrees create the best torque and overall power? Not sure as I need to do more testing to validate this. However as Bry195 mentioned before, "as you increase timing, you are field weakening", which is also known as widening the power. However when it comes to spec racing, you need to find the setting that produces the torque and power that the motor can produce before it starts to generate too much heat. Remember that as you widen the power band, and depending on the track layout you have in front of you should also influence what setting you select. If grip is high, its a no brainer, torque.
Lastly here is a comparison of two motors, with one motor at two different timing settings. You can see the field weakening that happens when you go from 30 to 41 degrees timing for the motor.
For those who are interested in seeing the field weakening results of the R1 v21, I will be posting the results soon on my Facebook page.
if the gearing wont let you use 7000 rpm then set it to run the motor at 7500 and adjust the timing to 41. this is just an example (not a great one but for demonstration). a better example would be if the track needed 10000 rpm. maybe 52 degrees of timing and gear to 10000 rpm.
67 volts? did I see over 400 amps? wow, I get less than 200 amps on a 17.5 at 8+ volts but I never ran that low of voltage.
08-06-2020 | 06:05 PM
#27
your first curve shows a peak around 7000 rpm. at 7000 rpm divided by the fdr and multiplied by the distance the tire rolls gets you a fast lap time thats the right timing. you can calculate the what the track needs by selecting a time to run a lap over the distance and convert to rotations per minute at the motor.
if the gearing wont let you use 7000 rpm then set it to run the motor at 7500 and adjust the timing to 41. this is just an example (not a great one but for demonstration). a better example would be if the track needed 10000 rpm. maybe 52 degrees of timing and gear to 10000 rpm.
67 volts? did I see over 400 amps? wow, I get less than 200 amps on a 17.5 at 8+ volts but I never ran that low of voltage.
In response to your question about 67 volts, the scaling on the power run fitting module defaults to a different unit of measure which is why you see the high values. The graph showing torque displays correctly when you adjust the settings.
08-06-2020 | 09:21 PM
#29
Tech Master
Joined: Jul 2018
Posts: 1,011
From: Florida
if you want to test a motor you have to simulate the acceleration loads and the work loads. a flywheel dyno is great for measuring power during acceleration but after acceleration it doesnt provide useful data. it does provide data that allows you to match inertia so that deceleration and acceleration can be tuned.
a load dyno can provide power curves and simulate the work that has to be done at a constant speed so its good for measuring power, torque, rpm. it doesnt help with inertia. but what it does very well is allow you to test the thermal characteristics of a motor under work conditions. this allows you to determine the max power a motor can deliver without overheating.
if you had an inertia and load dyno in one you would need to do less testing and math to understand everything a motor can do. if the flywheel matches the inertia your chassis normally introduces during acceleration you have 1 of 2 pieces of physics covered. the second piece is the friction and and efficiencies of the chassis which can be simulated by the brake motor (the second motor) resisting the same way tires and belts and ... does on a chassis.
but there in lies the problem. you can calculate the inertia and pick a flywheel to simulate. but then you have to determine how much power is lost between the motor and the wheels to setup the load motor to introduce those same losses.
If it were me and you wanted to cover these two pieces of physics I would get a chassis and add a load motor. you can run a fixed pwm to the load motor to simulate friction on track but its will be different for each track. it would also be flight cheaper to get a motor acceleration dyno and add a load motor that would simulate heat rain and road conditions.
in short I wouldnt convert a motor only load dyno over to brushless unless you are pretty decent with DIY. if you dont simulate the inertia under acceleration you are only half way there.
max rain-you may find more power and less heat if you come into a corner at 3000 and exit at 10,500 because the average corner speed of 7000 is your peak power. peak efficiency will be 15-20% higher so it would come out even cooler.
08-07-2020 | 04:28 AM
#30
Joined: Aug 2008
Posts: 2,388
From: Medina, Ohio
There are chassis dynos with load motors. I have one but it is a simple one. Bank of resistors to give three loads. Simple amp draw of test motor and load motor voltage generation to determine wheel speed. Have thought about equipping it with a accurate sensor system for true motor rpm via the sensor wire tap off.
I will add one of my theories that is backed by Tekin esc data. On tight indoor road courses or ovals, the motor is always in acceleration or deceleration. Hardly ever does one peak out unless your gearing is too low. To get the most from a motor, it must be worked as much as possible.
I will add one of my theories that is backed by Tekin esc data. On tight indoor road courses or ovals, the motor is always in acceleration or deceleration. Hardly ever does one peak out unless your gearing is too low. To get the most from a motor, it must be worked as much as possible.