


 13Likes
Measuring Amperage @ Battery Vs. Motor?
 11-14-2019, 08:21 AM
#31
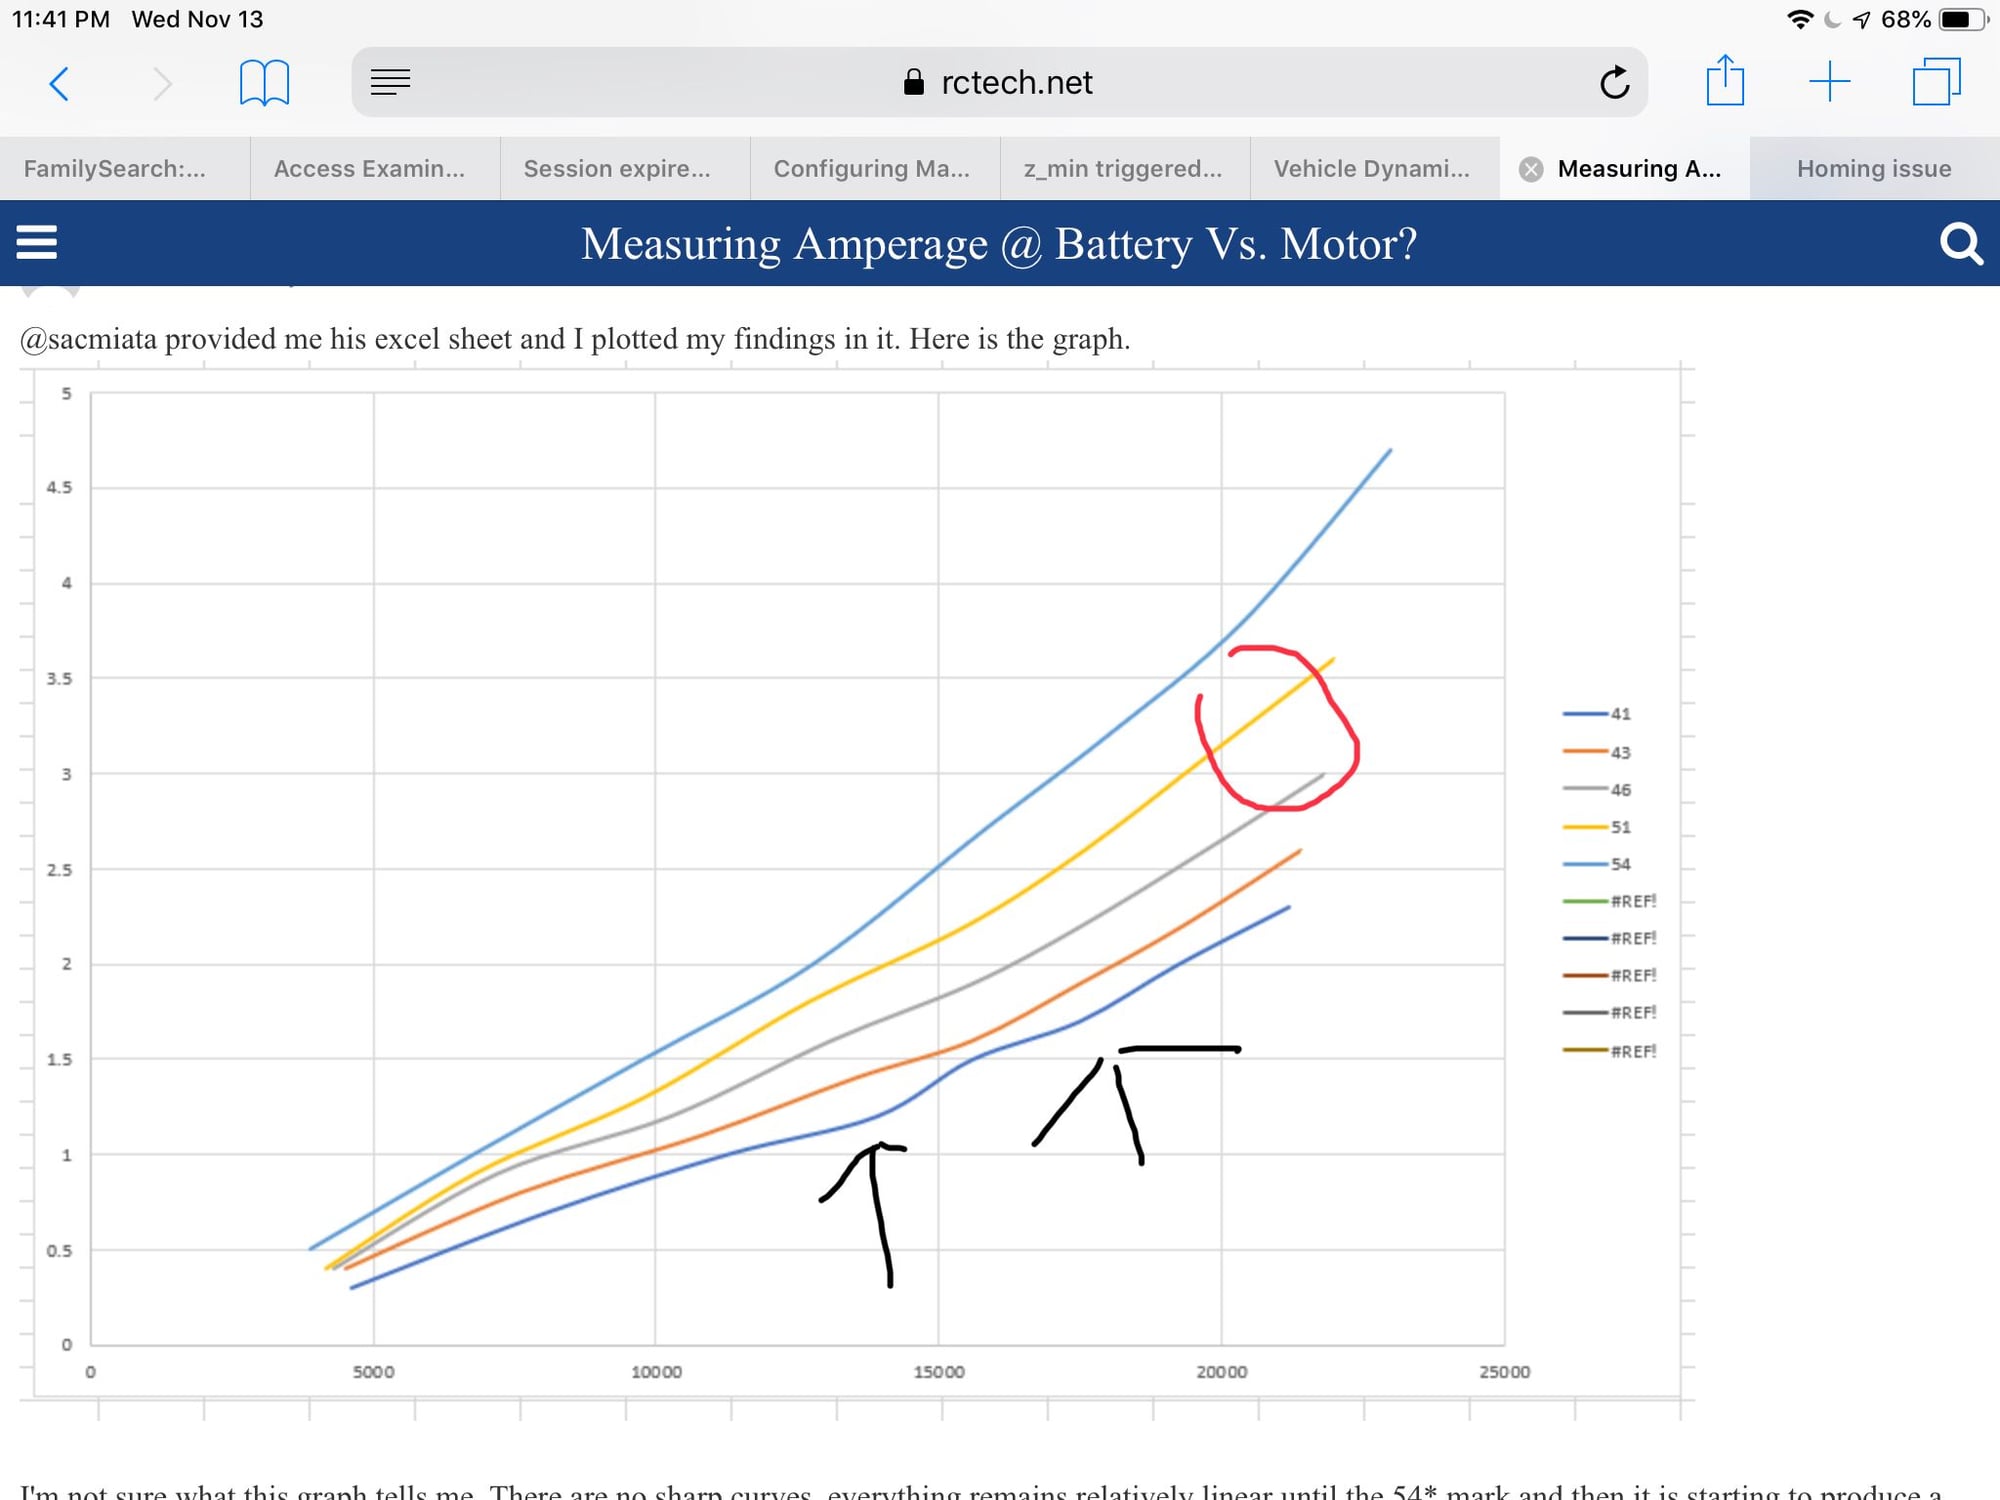
at 41 degrees and 140 you are getting more speed for every unit of current. this is efficiency. the next couple timings have the same plateau pushed slightly right. i see 2 plateaus in some curves which usually means bad data or a bad rotor.
the plateau gets harder to see as timing goes up but its there. Its easier to see at lower timings because your peak efficiency will be something like 70% and as the timing goes up and pushes rpms to the right the peak efficiency will be for example 50% or 40%. Since very early in the rpm of a high timing curve it starts at 20-30% its hard to see the peak because its getting closer to the average efficiency.
Look at the plateaus in lower rpms. This is efficiency. Look at the curve of the next higher timing and you will see the same plateau but smaller. Then the next and it will be smaller. This is what happens to peak power and peak efficiency as the timing goes up. Less peak more average. But overall less under the curve because the trade for moving the plateau right is taking allot more of the peak than it gives back.
divide rpms by current. Its the slope. The lower the slope the more efficiency. The big plateau at 40 ish degrees will give you the least to the right and the most to the left. Add timing until you are taking more away from the left than you are gaining to the right and then go back down one timing level. That�s the sweet spot.
I can see 2 knees in every curve. The one to the right seems to be moving in the right direction on most of the curves. But the one on the left is moving away from the one on the right. Somethings wrong. But if you think about it....a dead spot in power would get worse as the timing gets better for high rpm because the magnetic field is not inducing motion very well and you make it worse by making the timing wrong for low rpm. It just gets more wrong as the timing goes up. If you bad spot moves progressively left it will minimize the bump to the right moving right as the timing goes up. That�s my guess as to why the bump to the right moves right for awhile at a fairly constant rate and then stops moving at that rate.
46 looks the best because timings higher than this diverge rapidly at a different slope. Allot more current for not allot of rpm. Look at the pattern of plateaus but start by calibrating your eyes at the low timing and watch them spread as the timing goes up.
I continue to enjoy reading your posts and learning something new... Now to start shopping for a motor analyzer.
 11-14-2019, 12:10 PM
#32
Finally got to the track for practice and played more with gearing and timing. Although - I had to change my gearing obliviously going from 49 to 47 so after I got that settled in my pop out of corners was better and my top wheel speed didn't really change. Overall was a little quicker on the track but the extra low end available at 47* helped setting up a couple jumps that have little lead in to them. Also adjusted to 48 and it was crazy at the same gearing how much pop was lost. 46 felt good but I dropped some overall speed down the straight so leaving it at 47.
Sad thing is after all this effort I am still buying a X-Factor anyways!
waitwait - great looking video only got 10 minutes in and will have to finish another time but lots of good information.
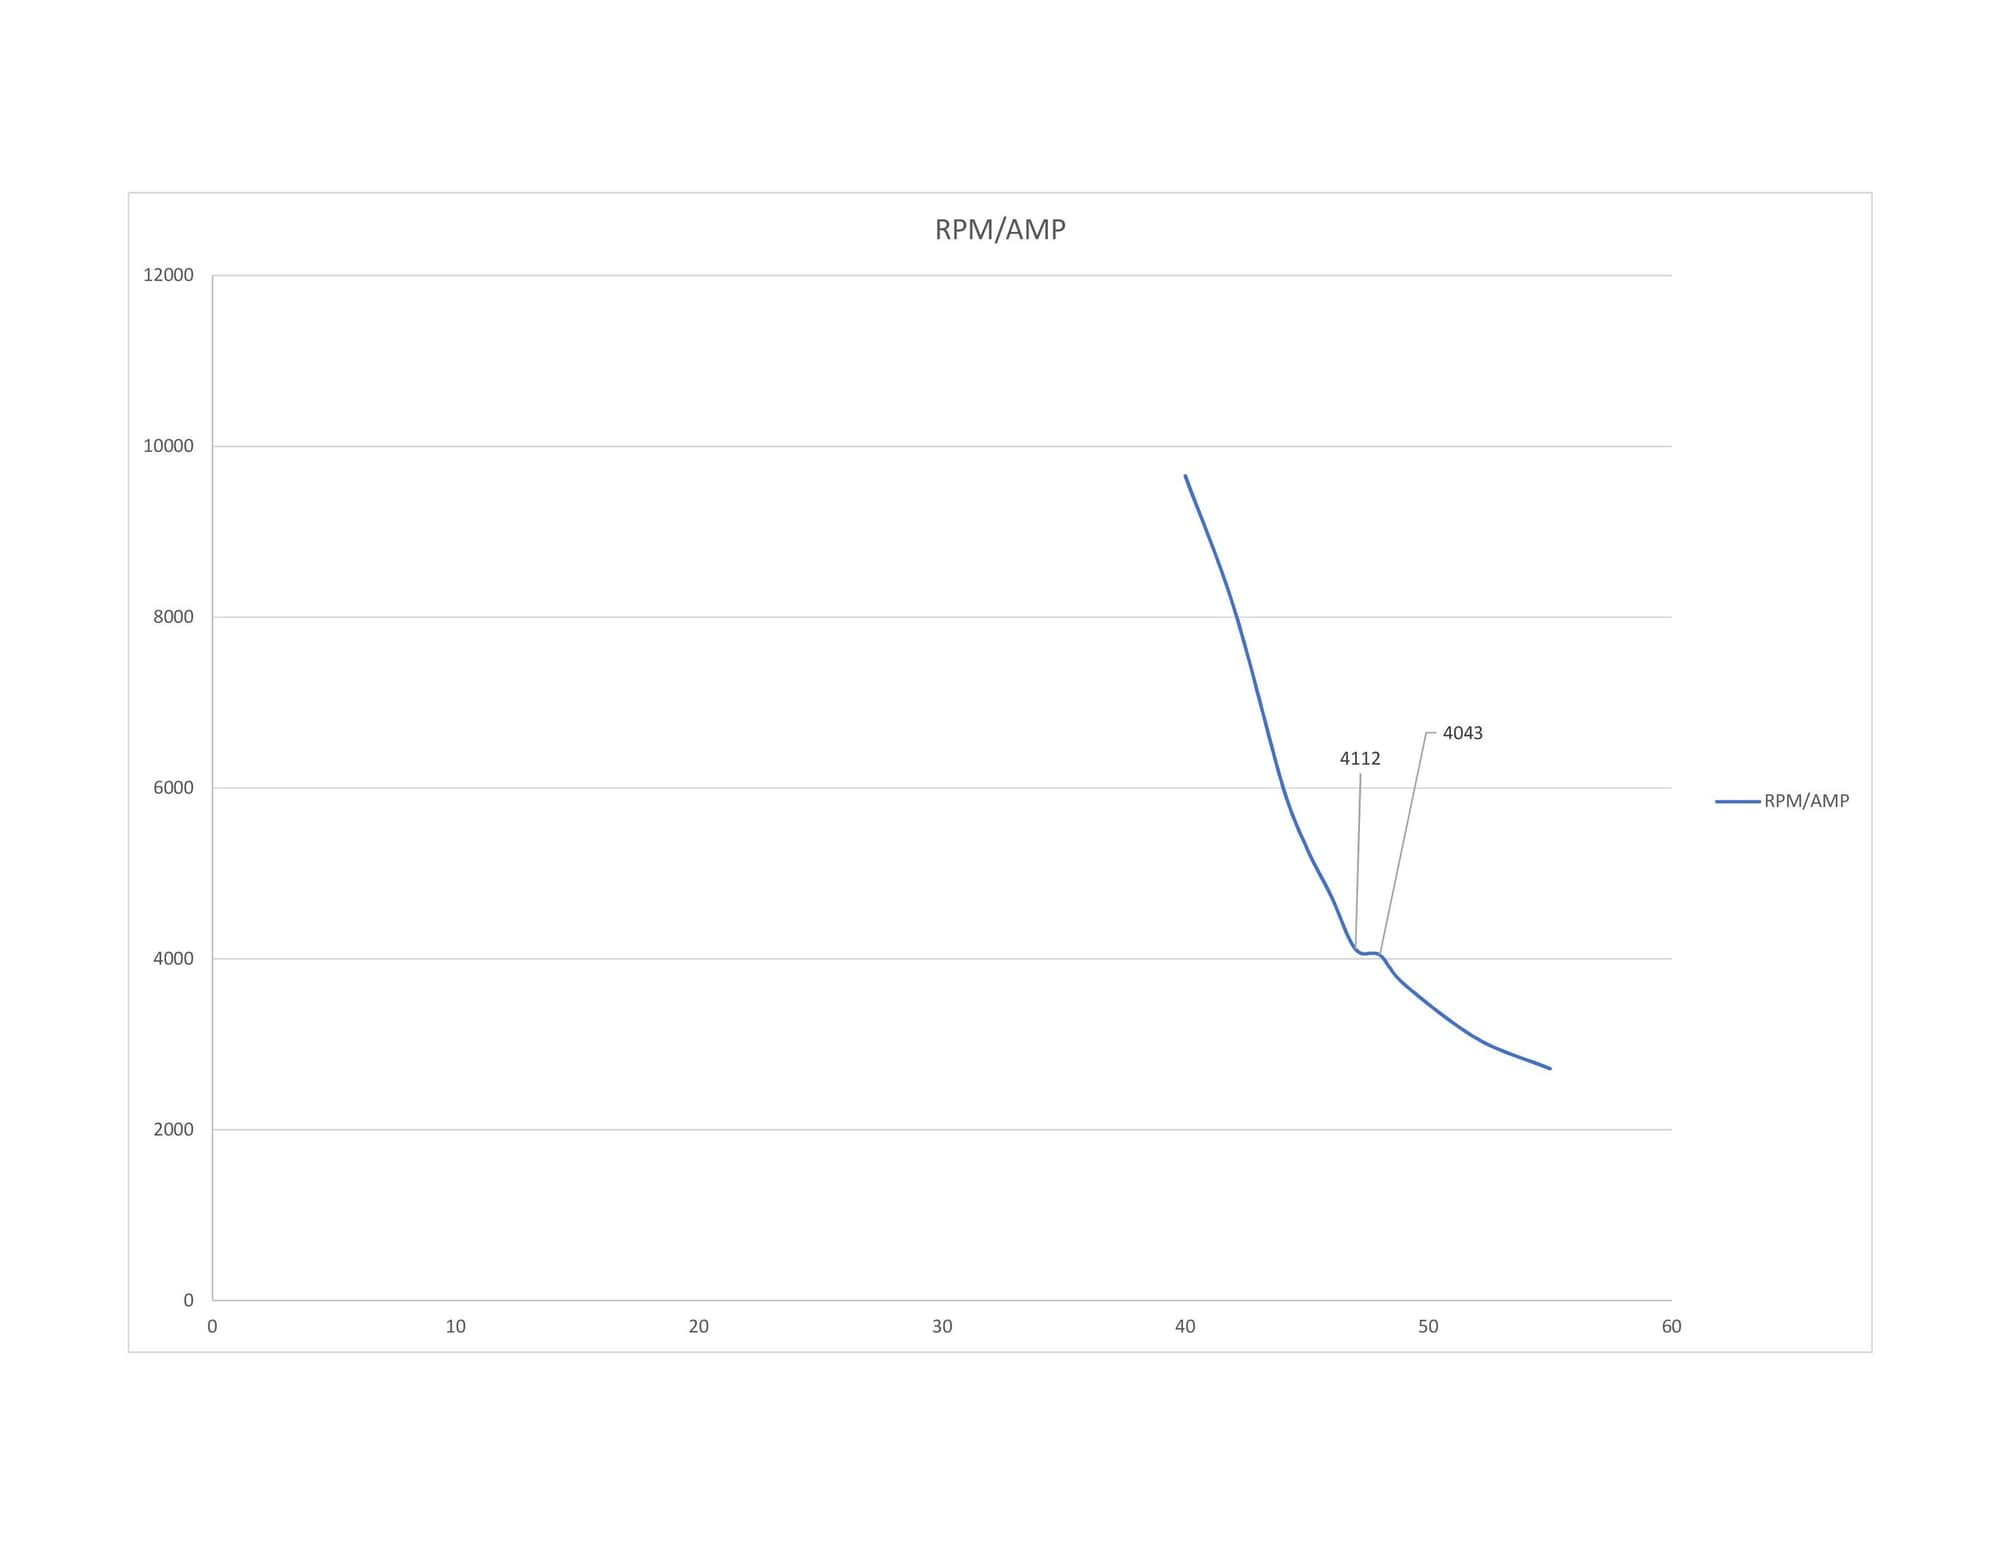
Trillian - somewhat surprised that your max RPM didn't change overall between that large of a timing change but this is all new to me to. On the RPM to Current ratio this is what mine looked like where you could see at 4112 RPM/AMP (47*) and 4043 RPM/AMP (48*) there is a relatively large change in efficiency on how this motor uses its power.
Sad thing is after all this effort I am still buying a X-Factor anyways!
waitwait - great looking video only got 10 minutes in and will have to finish another time but lots of good information.
Trillian - somewhat surprised that your max RPM didn't change overall between that large of a timing change but this is all new to me to. On the RPM to Current ratio this is what mine looked like where you could see at 4112 RPM/AMP (47*) and 4043 RPM/AMP (48*) there is a relatively large change in efficiency on how this motor uses its power.
11-14-2019, 12:30 PM
#33

@sacmiata,
I was a little surprised as well. I plotted points for a tsr 17.5 as well and it had more change, but still not as much as yours. Max rpm at 38* was 26000, and at 53* was 32000. Also I noticed that I was loosing a little on the voltage under load, so my 8.4v supply was dropping to about 8.1v at 53* timing. I am going to repeat the test with a charged battery for supply and see what happens to the voltage.
I was a little surprised as well. I plotted points for a tsr 17.5 as well and it had more change, but still not as much as yours. Max rpm at 38* was 26000, and at 53* was 32000. Also I noticed that I was loosing a little on the voltage under load, so my 8.4v supply was dropping to about 8.1v at 53* timing. I am going to repeat the test with a charged battery for supply and see what happens to the voltage.
11-14-2019, 06:55 PM
#34
Tech Master
Bry195, thank you for continuing to share your expertise! I see detailed, knowledgeable replies from you on many threads! Your help and knowledge is exactly what the hobby needs!
I continue to enjoy reading your posts and learning something new... Now to start shopping for a motor analyzer.
I continue to enjoy reading your posts and learning something new... Now to start shopping for a motor analyzer.
Last edited by Bry195; 11-14-2019 at 07:20 PM.
Currently Active Users Viewing This Thread: 1 (0 members and 1 guests)
