


 54Likes
RC10B4/T4 Forum
 02-11-2009, 08:38 PM
#6886

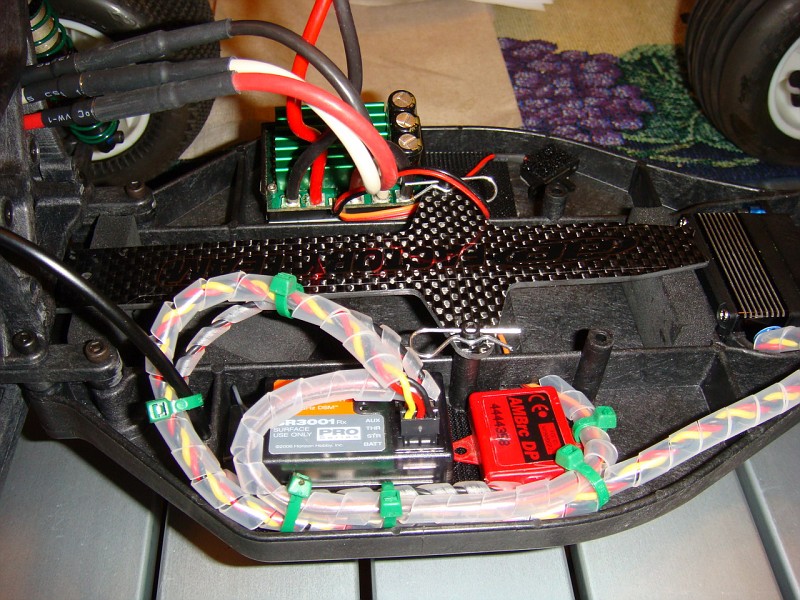
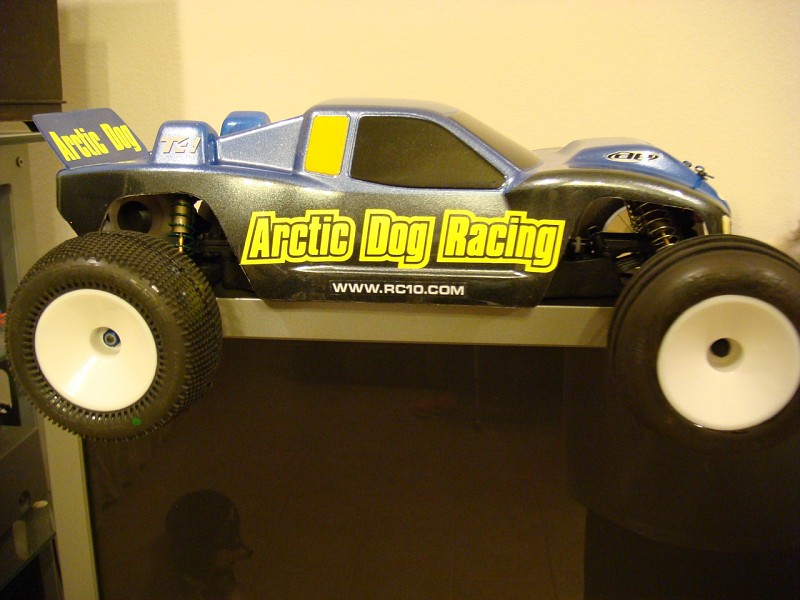
...I finally finished my new FT T4 build. I had been racing for the last 3 months one I bought 2nd hand to see if I liked 2WD truck. I do like the class so I wanted to have my own build.
Build info:
FT T4
Mamba Max w/ 4600kV
Spektrum 3001
Hitec 7955 steering servo (overkill for the T4, I stole it from my MBX6 until I find something else.)
It will be run with SMC 2S 24C 5200 battery packs with the battery shifted to the front.
Build info:
FT T4
Mamba Max w/ 4600kV
Spektrum 3001
Hitec 7955 steering servo (overkill for the T4, I stole it from my MBX6 until I find something else.)
It will be run with SMC 2S 24C 5200 battery packs with the battery shifted to the front.

 02-12-2009, 02:09 PM
#6889
Mattnin,
Nice to see you are trying to get the most out of your Sentry (Im sure many people just use it to check top speed!).
Ive worked on full size race cars a fair bit and have used the g-g curve to evaluate driving style and car performance. A few comments:
- you have the braking and driving direction in your graph the wrong way around
- you are being a bit hard on yourself re: clumpng around the centre! There are two reasons: 1) in off road, the car spends a fair bit of time in the air when the only force is gravity 2) When you are driving in a straight line close to top speed your motor cant accelerate the car even though the tyres still have grip.
- looking at the graph, it appears you are doing very little braking in a straight line but this is normal with 2wds - the front tyres actually contribute to braking when they are at full lock. Hence the 'V' shape of the graph.
I have found it useful to create a graph of 'Total G'. This is the amount of g force from cornering and accel/brake combined. Using trig, it is sqrt(Ax^2 + Ay^2). Plot this on the same time axis as vehicle speed/RPM so you can see where you are around the track. Ideally, you want this to stay at a high level all around the track - it means you are driving at the limit of the tyres. You will see that it drops down on the straight (especially in stock class) but this is OK as you are at the limit of the motor.
The Sentry is a great tool and if you are prepared to spend a bit of time going through the data Im sure you will be able to improve your lap times!
L8r
Ray
I thought some of you might like to see this. Using a Novak Sentry data logger in a FT T4 stock truck class with a Novak 13.5 motor, hole shot tires blue groove (I took 1st place, point series race), I constructed a G-G Diagram which shows a graphical representation of the g-forces acting on the truck during the race. It is a tool used by race car engineers, and we have the capability to do it with our RC race cars too.
A quick analysis shows a clumping of data points on acceleration during a RH turn. Since we are running clockwise at the track, this makes sense since we are turning 360 degrees more RH than LH. It also shows a massive clumping of data points in the center which means that during much of the race, there weren't high g-forces acting on the chassis at all which means I wasn't driving at the limit. A better G-G diagram would show much fewer data points in the center (the data would be more scattered) and would mean I would be driving at the limit more.

A quick analysis shows a clumping of data points on acceleration during a RH turn. Since we are running clockwise at the track, this makes sense since we are turning 360 degrees more RH than LH. It also shows a massive clumping of data points in the center which means that during much of the race, there weren't high g-forces acting on the chassis at all which means I wasn't driving at the limit. A better G-G diagram would show much fewer data points in the center (the data would be more scattered) and would mean I would be driving at the limit more.
02-12-2009, 02:32 PM
#6890
that they are working on a light setup but its not worked out yet.
02-12-2009, 02:53 PM
#6891
I thought some of you might like to see this. Using a Novak Sentry data logger in a FT T4 stock truck class with a Novak 13.5 motor, hole shot tires blue groove (I took 1st place, point series race), I constructed a G-G Diagram which shows a graphical representation of the g-forces acting on the truck during the race. It is a tool used by race car engineers, and we have the capability to do it with our RC race cars too.
A quick analysis shows a clumping of data points on acceleration during a RH turn. Since we are running clockwise at the track, this makes sense since we are turning 360 degrees more RH than LH. It also shows a massive clumping of data points in the center which means that during much of the race, there weren't high g-forces acting on the chassis at all which means I wasn't driving at the limit. A better G-G diagram would show much fewer data points in the center (the data would be more scattered) and would mean I would be driving at the limit more.
A quick analysis shows a clumping of data points on acceleration during a RH turn. Since we are running clockwise at the track, this makes sense since we are turning 360 degrees more RH than LH. It also shows a massive clumping of data points in the center which means that during much of the race, there weren't high g-forces acting on the chassis at all which means I wasn't driving at the limit. A better G-G diagram would show much fewer data points in the center (the data would be more scattered) and would mean I would be driving at the limit more.
02-12-2009, 02:58 PM
#6892
Mattnin,
Nice to see you are trying to get the most out of your Sentry (Im sure many people just use it to check top speed!).
Ive worked on full size race cars a fair bit and have used the g-g curve to evaluate driving style and car performance. A few comments:
- you have the braking and driving direction in your graph the wrong way around
- you are being a bit hard on yourself re: clumpng around the centre! There are two reasons: 1) in off road, the car spends a fair bit of time in the air when the only force is gravity 2) When you are driving in a straight line close to top speed your motor cant accelerate the car even though the tyres still have grip.
- looking at the graph, it appears you are doing very little braking in a straight line but this is normal with 2wds - the front tyres actually contribute to braking when they are at full lock. Hence the 'V' shape of the graph.
I have found it useful to create a graph of 'Total G'. This is the amount of g force from cornering and accel/brake combined. Using trig, it is sqrt(Ax^2 + Ay^2). Plot this on the same time axis as vehicle speed/RPM so you can see where you are around the track. Ideally, you want this to stay at a high level all around the track - it means you are driving at the limit of the tyres. You will see that it drops down on the straight (especially in stock class) but this is OK as you are at the limit of the motor.
The Sentry is a great tool and if you are prepared to spend a bit of time going through the data Im sure you will be able to improve your lap times!
L8r
Ray
Nice to see you are trying to get the most out of your Sentry (Im sure many people just use it to check top speed!).
Ive worked on full size race cars a fair bit and have used the g-g curve to evaluate driving style and car performance. A few comments:
- you have the braking and driving direction in your graph the wrong way around
- you are being a bit hard on yourself re: clumpng around the centre! There are two reasons: 1) in off road, the car spends a fair bit of time in the air when the only force is gravity 2) When you are driving in a straight line close to top speed your motor cant accelerate the car even though the tyres still have grip.
- looking at the graph, it appears you are doing very little braking in a straight line but this is normal with 2wds - the front tyres actually contribute to braking when they are at full lock. Hence the 'V' shape of the graph.
I have found it useful to create a graph of 'Total G'. This is the amount of g force from cornering and accel/brake combined. Using trig, it is sqrt(Ax^2 + Ay^2). Plot this on the same time axis as vehicle speed/RPM so you can see where you are around the track. Ideally, you want this to stay at a high level all around the track - it means you are driving at the limit of the tyres. You will see that it drops down on the straight (especially in stock class) but this is OK as you are at the limit of the motor.
The Sentry is a great tool and if you are prepared to spend a bit of time going through the data Im sure you will be able to improve your lap times!
L8r
Ray
Just saw this after posting.. I guess I need to go back to math class!
 I guess the dots are useful, I just don't know how to read it. But I think you can export all the data to excel? then massage as you please...
02-12-2009, 03:27 PM
I guess the dots are useful, I just don't know how to read it. But I think you can export all the data to excel? then massage as you please...
02-12-2009, 03:27 PM
#6893
Exporting to Excel is pretty easy, and then you can do a lot more with it. You can split up laps to compare one to another - this is probably the easiest way to look at the consistency of your driving.
What makes data logging really useful is if you can put it in a few different cars (or get different drivers to drive your car) and compare driving styles. If you can get a local hotshot to have a drive you will quickly be able to see where they are carrying more speed, braking earlier, whatever... it ownt necessarily make you a better driver but you will know where you have to work on your driving.
Ray
02-13-2009, 08:35 AM
#6894
02-14-2009, 07:00 AM
#6896
how bout pic's
02-14-2009, 07:01 AM
#6897
of the girl
02-14-2009, 04:07 PM
#6899
Tech Initiate
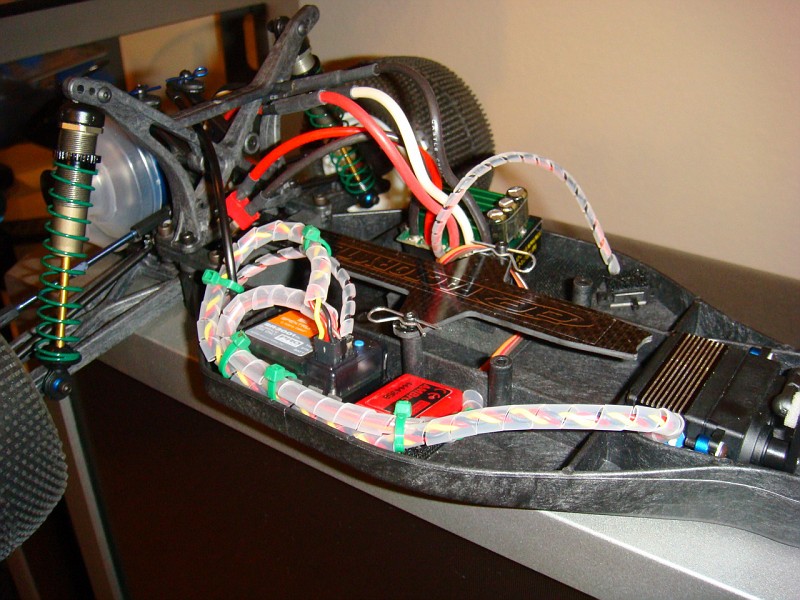
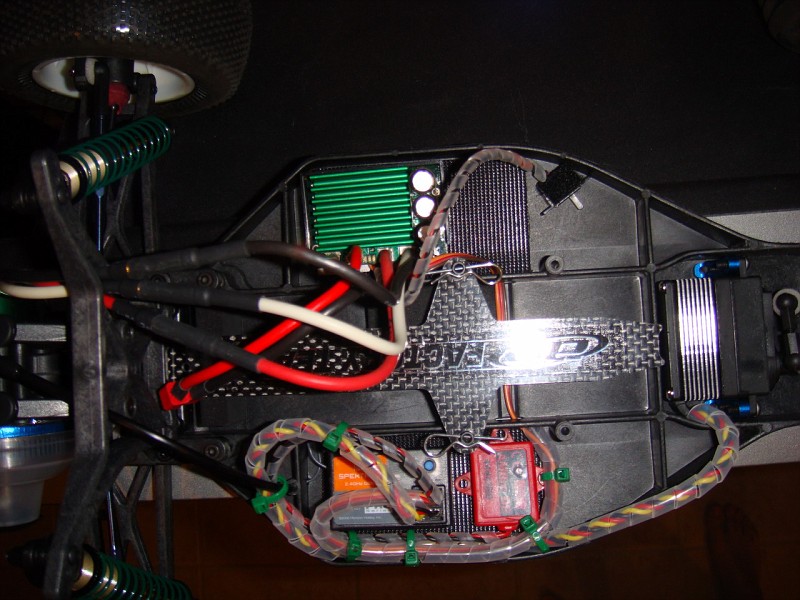
looking good, nice electrical layout. What motor are you running?
02-14-2009, 05:58 PM
#6900
Ray